

UPDATE
This article has been superseded by a more recent survey.
View the 2023 bookmaker margin survey results.
The following are the results of a September 2021 bookmaker margins and markets survey. The survey is split into racing and sports surveys.
This study follows up on our 2011, 2012, 2013, 2015 and 2017 margin surveys.
What are Bookmaker Margins?
The bookmaker margin, also known as the overround, the cut or the take, is the hidden amount charged by a bookmaker for accepting a wager.
When a bookmaker sets the odds they first estimate the probability of each possible outcome. In a fair coin toss, for example, the probability of heads is 50%. When using the decimal/European odds system the fair odds, also known as the true odds, equal the reciprocal of the bookmaker’s estimated probability, in this case 1 / 50% = 2.00. To fund their services, the bookmaker adjusts these odds downward to create a profit margin. Typical odds on a selection with a 50% chance of winning are 1.91. The gap between the bookmaker’s odds (1.91) and the fair odds (2.00) is due to the bookmaker margin.
The bookmaker margin is a measure of the bookmaker’s profit margin for an event and is a hidden transaction cost for punters. This profit is how bookmakers finance their services but bookmakers vary in the margins they apply. From a punter’s perspective, the lower the margin, the better. The difference between 1.90 and 1.92 line odds may not seem significant for a single wager, but when betting repeatedly this difference has a compounding effect. This can make the difference between winning and losing money in the long-term.
Calculating Bookmaker Margins
When using decimal odds the bookmaker margin equals the sum of the reciprocals of the odds, minus 1. Below are calculation examples using two-outcome and three-outcome events.

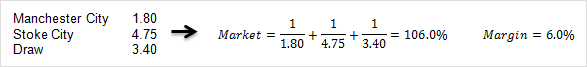
The margin is amount by which the market exceeds 100%.
For a 100.0% market the margin is zero. If you compile the best available odds across a number of bookmakers and the combined market is below 100.0%, then the margin is negative, which means an arbitrage opportunity may exist.
Interpreting Bookmaker Margins
The margin measures the bookmaker’s profit if they were to receive wagers on each outcome in proportion to the odds. Suppose a bookmaker offers decimal odds a on outcome A and odds b on outcome B. If proportion b/(a+b) is wagered on outcome A and a/(a+b) is wagered on outcome B, then the bookmaker will receive the same profit regardless of the result.
For example, recall that the bookmaker margin for the two-outcome event above was 3.5%. Suppose $100,000 in total is wagered on the market, with:
(1.64/(1.64 + 2.35)) x $100,000 = $41,102.76 wagered on Oklahoma City and
(2.35/(1.64 + 2.35)) x $100,000 = $58,897.24 wagered on Denver.
Depending on the outcome, the bookmaker will pay out one of the following two amounts:
If Oklahoma City wins: $41,102.75 x 2.35 = $96,591.48
If Denver wins: $58,897.24 x 1.64 = $96,591.48
The bookmaker accepts $100,000 in wagers but only pays out $96,591.48 to the winners. The profit margin is ($100,000 – $96,591.48)/$96,591.48 = 3.5%, as calculated by the margin earlier.
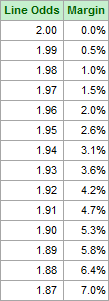
To provide perspective on how odds relate to margins, the table on the right compares equal line odds (bets with a 50% chance of winning) to their respective margins. Note that 2.00 line odds equate to a margin of 0%, where the bookmaker makes no profit on the market.
Bookmaker Margin vs. Vigorish (Vig)
Another popular term, particularly in the United States, for measuring the bookmaker profit margin is vigorish. It is often referred to as vig, for short, or juice. In the context of this article the term vigorish refers to a different calculation to bookmaker margin. In short, the bookmaker margin is the bookmaker’s profit margin relative to the payouts to the winners, while vigorish refers to the profit margin relative to turnover, i.e. the initial wagers. Because the total payout is always less than the total turnover, the bookmaker margin is greater than vigorish for positive margins.
Unfortunately there are conflicting definitions of bookmaker margin and vigorish. Even on Wikipedia the explanation of how to calculate vigorish depends on which article you visit. This survey uses the definition of bookmaker margin (overround) as used in the Mathematics of bookmaking Wikipedia article and the definition of vigorish as used in the Vigorish Wikipedia article.
Referring to the previous NBA example:
The bookmaker margin is 1/1.64 + 1/2.35 – 1 = 3.53%
while vigorish is (1 – 1.64*2.35/(1.64 + 2.35)) = 3.41%
Recall that with this example, if $41,102.76 is wagered on Oklahoma City and $58,897.24 is wagered on Denver, the bookmaker accepts $100,000 in wagers and pays out $96,591.48 to the winners, regardless of the result. The bookmaker margin is ($100,000 – $96,591.48)/$96,591.48 = 3.53%, while vigorish is ($100,000 – $96,591.48)/$100,000 = 3.41%.
Both of these measures of bookmaker profit margin are valid, providing you understand what each represents. You can think of bookmaker margin as metres and vigorish as yards.
Note that if the bookmaker margin is 0% then vigorish is also 0%. If one is negative then so is the other.
The choice of bookmaker margin over vigorish has no impact on this survey. If the bookmaker margin of one bookmaker is higher than another’s, then the same can be said for that bookmaker’s vigorish. The relative value between bookmakers is the focus of this survey, not the actual values.
To learn more about bookmaker margins and vigorish, check out our bookmaker margin / vigorish calculator.
Combined Margins
For each market a “combined” margin is calculated by sourcing the best available odds across the surveyed bookmakers. This combined margin represents the realisable margin that can be attained through holding a portfolio of bookmaker memberships and shopping around for the highest odds.
The combined margin is always equal to or lower than the lowest bookmaker’s margin. The greater the disparity between the odds of two or more bookmakers, the lower the combined margin.
For example, in the US Open men’s singles match between Djokovic and Brooskby, which was included in this survey, we observed the following head-to-head markets:
bet365:
Djokovic: 1.04
Brooskby: 13.00
PlayUp:
Djokovic: 1.01
Brooskby: 18.75
The bookmaker margin for bet365 is 3.85% while the margin for PlayUp is 4.34%.
If we combine the two markets by taking the highest available odds we get:
Djokovic: 1.04
Brooskby: 18.75
The combined margin for this market is 1/1.04 + 1/18.75 – 1 = 1.49%.
Combined margins are a crucial for beating bookmakers because they lowers the hurdle rate required to achieve a profit. The equivalent line odds for the 3.85% margin at bet365 is 1.926. To make a profit on 1.926 odds you would have to win more than 51.9% of the time. In contrast, the equivalent line odds for the 1.49% combined margin is 1.971. To make a profit on 1.971 odds you would only need to win more than 50.7% of the time.
Note that if the combined margin is a negative number then an arbitrage opportunity exists.
Racing Margin Survey Results
For one week in September, 2021, fixed win and place odds were recorded for a random selection of thoroughbred, harness and greyhound races. The odds were recorded on the day of each race.
The average of the win and place margins are shown in the tables below. The Overall Racing Margins table combines the average margins across the three racing types.
Table 1 – Thoroughbred Margins
| Bookmaker | Thoroughbreds Margin | Rank |
|---|---|---|
| bet365 | 23.8% | 1 |
| BlueBet | 27.6% | 4 |
| PlayUp | 29.6% | 5 |
| Sportsbet | 24.9% | 2 |
| Unibet | 26.1% | 3 |
| WinnersBet | 32.6% | 6 |
| Combined | 20.2% | |
| Average | 27.4% |
Table 2 – Harness Margins
| Bookmaker | Harness Margin | Rank |
|---|---|---|
| bet365 | 26.5% | 1 |
| BlueBet | 28.4% | 4 |
| PlayUp | 36.0% | 6 |
| Sportsbet | 27.8% | 3 |
| Unibet | 27.8% | 2 |
| WinnersBet | 34.1% | 5 |
| Combined | 22.5% | |
| Average | 30.1% |
Table 3 – Greyhound Margins
| Bookmaker | Greyhounds Margin | Rank |
|---|---|---|
| bet365 | 26.4% | 1 |
| BlueBet | 32.5% | 4 |
| PlayUp | 34.9% | 5 |
| Sportsbet | 31.1% | 3 |
| Unibet | 29.7% | 2 |
| WinnersBet | 37.2% | 6 |
| Combined | 24.0% | |
| Average | 31.9% |
Table 4 – Overall Racing Margins
| Bookmaker | Racing Margin | Rank |
|---|---|---|
| bet365 | 25.6% | 1 |
| BlueBet | 29.5% | 4 |
| PlayUp | 33.5% | 5 |
| Sportsbet | 27.9% | 3 |
| Unibet | 27.8% | 2 |
| WinnersBet | 34.6% | 6 |
| Combined | 22.2% | |
| Average | 29.8% |
bet365 came out as the winner with the lowest margins across all three forms of racing. Unibet and Sportsbet were a close 2nd and 3rd, with Unibet offering lower margins for the surveyed greyhounds and harness races, while Sportsbet had lower margins than Unibet for the surveyed thoroughbred races.
Note that the actual margin figures are of less importance than the relative margins between the bookmakers because racing margins vary depending on the number of runners in the field. Generally the greater the number of runners, the greater the margin.
Table 5 – Instances of Best Racing Odds
| Bookmaker | Best Odds | Rank |
|---|---|---|
| bet365 | 68 | 1 |
| BlueBet | 5 | 4 |
| PlayUp | 3 | 5 |
| Sportsbet | 28 | 2 |
| Unibet | 14 | 3 |
| WinnersBet | 0 | 6 |
Table 5 shows the number of times that each bookmaker offered uniquely the best available odds for a particular selection.
bet365 came out clear on top with 68 instances of offering higher odds for a runner than any other bookmaker. Sportsbet was next best with 28, twice as many as Unibet. This result highlights the fact that a bookmaker doesn’t need to have the lowest margins to be valuable in a portfolio of memberships when shopping around. A bookmaker can be useful simply for offering contrasting odds to the other bookmakers on particular runners.
The results illustrate that between them, bet365, Sportsbet and Unibet make a valuable combination of bookmakers for fixed odds racing. On only 8 occasions did a bookmaker other than these three offer the best odds for a particular selection.
Sports Margin Survey Results
For one week in September, 2021, the odds for up to three popular markets, along with the total number of markets, were recorded for a selection of fixtures.
The following leagues and markets were included in the survey:
AFL: head-to-head, line, total score (over/under)
NRL: head-to-head, line, total score (over/under)
NFL: head-to-head, line, total score (over/under)
EPL: head-to-head, over/under 2.5 goals
MLB: head-to-head, line, total score (over/under)
WNBA: head-to-head, line, total score (over/under)
Rugby Championship: head-to-head, line
US Open (tennis): head-to-head
International ODI cricket: head-to-head
For the AFL, NRL, NFL and EPL the odds were recorded once a day from Monday through to Friday. For the remaining sports the odds were recorded within 24 hours of the events commencing.
Table 6 provides the average margins for the surveyed leagues. The “Equivalent Line” column shows the equivalent line odds for the respective margins.
Table 6 – Margins and markets survey results
| Bookmaker | Margin | Equivalent Line | Rank |
|---|---|---|---|
| bet365 | 5.0% | 1.905 | 2 |
| BlueBet | 5.5% | 1.896 | 3 |
| PlayUp | 5.6% | 1.894 | 4 |
| Sportsbet | 5.6% | 1.894 | 5 |
| Unibet | 5.0% | 1.905 | 1 |
| WinnersBet | 7.4% | 1.862 | 6 |
| Combined | 3.7% | 1.929 | |
| Average | 5.7% | 1.892 |
Unibet and bet365 finished virtually neck and neck at 5.0%, with BlueBet the third best a fair way back at 5.5%. This was followed by PlayUp and Sportsbet just behind BlueBet at 5.6%.
The combined margin was 3.7%. This reflects the benefit of shopping around for odds rather than relying upon one bookmaker.
bet365, Sportsbet and Unibet each returned the same margin as in the 2017 survey. The other three bookmakers in this 2021 survey weren’t included in the 2017 study.
Table 7 – Instances of Best Sports Odds
| Bookmaker | Best Odds | Rank |
|---|---|---|
| bet365 | 125 | 2 |
| BlueBet | 40 | 5 |
| PlayUp | 42 | 4 |
| Sportsbet | 71 | 3 |
| Unibet | 127 | 1 |
| WinnersBet | 2 | 6 |
Unibet and bet365 finished almost neck and neck for the number of times that they alone offered the best available odds for a particular selection. It is noteworthy that Sportsbet finished well ahead of BlueBet and PlayUp for this statistic, despite having a similar margin to the other two bookmakers. This again highlights the fact that a bookmaker doesn’t have to offer the lowest margins to be a valuable addition to a portfolio of memberships. If it simply offers contrasting odds for particular selections then it will effectively reduce the combined margin when odds shopping.
BlueBet and PlayUp each offered the best odds for 40+ selections. Unlike the racing survey results – which were dominated by bet365, Unibet and Sportsbet – BlueBet and PlayUp did impact the combined margin with a high number of instances with the best odds.
Even WinnersBet, which had the highest margin, occasionally offered the best odds of any bookmaker for certain selections.
Bookmaker Margins By Market
The following tables display the bookmakers’ average margins broken down by market.
Table 8 – Head-to-head Margins
| Bookmaker | H2H Margin | Equivalent Line | Rank |
|---|---|---|---|
| bet365 | 4.8% | 1.908 | 2 |
| BlueBet | 5.4% | 1.898 | 3 |
| PlayUp | 5.8% | 1.890 | 5 |
| Sportsbet | 5.5% | 1.897 | 4 |
| Unibet | 4.7% | 1.910 | 1 |
| WinnersBet | 7.5% | 1.860 | 6 |
| Combined | 3.2% | 1.937 | |
| Average | 5.6% | 1.894 |
Table 9 – Line Margins
| Bookmaker | Line Margin | Equivalent Line | Rank |
|---|---|---|---|
| bet365 | 4.8% | 1.909 | 1 |
| BlueBet | 5.5% | 1.897 | 4 |
| PlayUp | 5.5% | 1.896 | 5 |
| Sportsbet | 5.4% | 1.898 | 3 |
| Unibet | 5.1% | 1.903 | 2 |
| WinnersBet | 6.8% | 1.872 | 6 |
| Combined | 4.1% | 1.921 | |
| Average | 5.5% | 1.896 |
Table 10 – Total Score Margins
| Bookmaker | Margin | Equivalent Line | Rank |
|---|---|---|---|
| bet365 | 4.9% | 1.907 | 1 |
| BlueBet | 5.5% | 1.896 | 3 |
| PlayUp | 5.5% | 1.895 | 4 |
| Sportsbet | 5.9% | 1.889 | 5 |
| Unibet | 5.1% | 1.903 | 2 |
| WinnersBet | 6.9% | 1.872 | 6 |
| Combined | 4.3% | 1.918 | |
| Average | 5.6% | 1.894 |
Unibet came out on top with the lowest margins in head-to-head markets, while bet365 had the lowest margins for both line and total score markets. bet365 offered 1.91 line odds for the AFL and NRL while most of the surveyed bookmakers offered 1.90 lines.
The benefit for shopping around for odds was greater for head-to-head markets than it was for line and total score markets. The combined margin was 3.2% for head-to-head, versus 4.1% for line and 4.3% for total score.
Markets Survey
The number of markets per fixture was surveyed for the same events as the odds survey.
To provide an example, if a bookmaker offers head-to-head, line, total score and winning margin markets for a game, then the number of markets is 4 for that fixture.
The AFL, NRL, NFL and EPL markets were surveyed each day from Wednesday to Friday while the tennis, MLB, WNBA, cricket and rugby markets were surveyed within 24 hours of the event start.
The average number of markets offered per fixture in each league are shown. The Average (Wed), Average (Thu) and Average (Fri) rows represent the average across the AFL, NRL, NFL and EPL on those days.
The final average for each sport has been calculated using the figures for the tennis, MLB, WNBA, cricket and rugby, along with the overall average figures for the AFL, NRL, NFL and EPL.
Much like in the odds survey, the actual market numbers are less relevant due to the arbitrary nature of the sports and leagues chosen. The focus is on the relative averages between the surveyed bookmakers.
The intention of this markets survey is to provide a general impression of the number of markets on offer. Bookmakers vary in the way they count markets so there may not be a substantial difference between, say 80 markets and 120 if the first bookmaker counts a “Pick Your Own Line” section as one market while the second bookmaker counts each line (-7.5, -6.5, -5.5, etc.) as a separate market.
Table 11 – Markets Survey – Part 1
| Sport/League | bet365 | BlueBet | PlayUp |
|---|---|---|---|
| Tennis | 83 | 15 | 7 |
| MLB | 64 | 25 | 3 |
| WNBA | 212 | 7 | 3 |
| Cricket | 35 | 7 | 1 |
| Rugby | 16 | 2 | 2 |
| AFL (Wed) | 87 | 40 | 3 |
| AFL (Thu) | 87 | 64 | 23 |
| AFL (Fri) | 114 | 71 | 44 |
| NRL (Wed) | 159 | 27 | 38 |
| NRL (Thu) | 161 | 31 | 45 |
| NRL (Fri) | 164 | 60 | 46 |
| NFL (Wed) | 219 | 90 | 11 |
| NFL (Thu) | 222 | 101 | 11 |
| NFL (Fri) | 232 | 184 | 16 |
| EPL (Wed) | 88 | 69 | 16 |
| EPL (Thu) | 127 | 69 | 17 |
| EPL (Fri) | 145 | 70 | 17 |
| Average AFL | 96 | 58 | 23 |
| Average NRL | 161 | 39 | 43 |
| Average NFL | 224 | 125 | 12 |
| Average EPL | 120 | 69 | 17 |
| Average (Wed) | 138 | 57 | 17 |
| Average (Thu) | 149 | 66 | 24 |
| Average (Fri) | 164 | 96 | 31 |
| Average | 112 | 39 | 12 |
| Rank | 2 | 4 | 5 |
Table 12 – Markets Survey – Part 2
| Sport/League | Sportsbet | Unibet | WinnersBet |
|---|---|---|---|
| Tennis | 72 | 39 | 3 |
| MLB | 120 | 116 | 3 |
| WNBA | 20 | 110 | 3 |
| Cricket | 23 | 52 | 1 |
| Rugby | 29 | 41 | 2 |
| AFL (Wed) | 159 | 285 | 2 |
| AFL (Thu) | 160 | 517 | 22 |
| AFL (Fri) | 190 | 533 | 22 |
| NRL (Wed) | 127 | 91 | 18 |
| NRL (Thu) | 141 | 266 | 19 |
| NRL (Fri) | 141 | 268 | 19 |
| NFL (Wed) | 206 | 186 | 6 |
| NFL (Thu) | 213 | 187 | 6 |
| NFL (Fri) | 231 | 187 | 9 |
| EPL (Wed) | 135 | 388 | 11 |
| EPL (Thu) | 135 | 432 | 11 |
| EPL (Fri) | 218 | 445 | 11 |
| Average AFL | 170 | 445 | 15 |
| Average NRL | 136 | 208 | 19 |
| Average NFL | 217 | 187 | 7 |
| Average EPL | 163 | 422 | 11 |
| Average (Wed) | 157 | 237 | 9 |
| Average (Thu) | 162 | 351 | 15 |
| Average (Fri) | 195 | 358 | 15 |
| Average | 105 | 180 | 7 |
| Rank | 3 | 1 | 6 |
Unibet came out on top with a whopping 180 markets per game on average. bet365 and Sportsbet came in 2nd and 3rd with similar figures of 112 and 105. There’s then a significant drop off to BlueBet at 39, before another large drop off to PlayUp at 12 and WinnersBet at 7.
The broad range of markets for Unibet, bet365 and Sportsbet make them suitable for anyone looking for a solitary bookmaker membership. Casual sports punters will find BlueBet to be perfectly adequate, while the limited range of markets for PlayUp and WinnersBet make them suitable only as part of a collection of memberships for those who are keen sports bettors.
Summary
bet365 came out on top with the lowest margins for all forms of racing. Between them, bet365, Unibet and Sportsbet accounted for almost all of the best available fixed odds for the surveyed runners.
Unibet and bet365 shared the lowest sports betting margins. While Sportsbet recorded higher sports margins, its odds often contrasted with the other bookmakers. For this reason it frequently offered the best odds for particular selections. In contrast to the racing results, BlueBet and PlayUp also had the best odds for numerous selections. Despite the higher margins, they too would be a useful addition to a portfolio of memberships for those who like to shop around for the best odds.
The combined bookmaker margins highlight the benefits of shopping around. This is particularly evident for head-to-head markets, with the combined margin coming in at 3.2%, compared to 4.7% for the survey-leading Unibet.
Unibet recorded by far the highest number of markets per game. The offerings of bet365 and Sportsbet were also incredibly high. This makes them more than sufficient to meet the needs of someone looking for only one bookmaker membership.
Odds Comparison
You can compare bookmaker odds for upcoming fixtures in the Bookmaker Odds Comparison section.
Caveats
This survey was conducted during one week in September, 2021. The surveyed margins were heavily dependent on the sample of sporting events chosen. Comparative margin levels may change over time and may differ for sports and leagues not covered in the survey.
This survey focuses on margins and the number of markets per fixture, but a key caveat is that betting limits are ignored. Furthermore, some bookmakers offer higher limits but may limit or close your account if you regularly win with high-stakes wagers. In addition, some bookmakers offer frequent promotions in lieu of lower odds, which is not factored into these stats.
I just wanted to applaud you on this excellent analysis and for doing all this work. Amazing!
Thanks and I hope you do this again in 2023.